Groups Responsible for Majority of GOP Ads;
Huge Republican Ad Advantage in House Races Disappears in August
(MIDDLETOWN, CT) September 4, 2014 – With prognosticators giving even odds that Republicans will take over the U.S. Senate after this November’s elections, outside groups are taking notice. Almost 52 percent of ads aired in favor of Republican candidates have been sponsored by interest groups, and that figure is 40 percent on the Democratic side. Groups have spent an estimated $97 million on advertising in Senate races this election cycle, which is up from the estimated $78 million spent to this point in the 2012 election cycle. Table 1 provides total ad counts by sponsor in Senate races in the current and the 2012 election cycles, including all ads aired through August 30 in each cycle.
![]()
While the volume of Democratic advertising trails the volume of Republican advertising somewhat in races for the Senate, the disparity in the volume of advertising is stark in U.S. House races, where Democrats are being trounced by Republicans (Table 2). More than twice as many ads favoring Republicans as ads favoring Democrats have aired this cycle. Indeed, the number of pro-Republican ads is up 28 percent over the 2012 election cycle, while the number of Democratic ads is down 24 percent. (These totals, as with Table 1, include primary and general election ads.)
![]()
Democrats, however, have recently upped their volume of advertising. For the month of August, 17,302 ads aired favoring Democratic House candidates compared to 16,072 ads favoring Republican House candidates.
“Democratic House candidates have been out-gunned this election cycle when it comes to advertising, but they have really caught up in the past month,” said Travis Ridout, co-director of the Wesleyan Media Project. “We won’t know until Election Day whether that early Republican advantage will turn into substantial Republican gains in the House or whether the money was wasted on voters who were not paying attention.”
The parties were at near parity in August for Senate races as well, with 54,595 Democratic ad airings and 53,447 Republican ad airings during the month. Figure 1 displays the overall balance of ads in federal races for the month of August (through 8/30) this year with dark red showing areas of heavy GOP advantage in airings and dark blue heavy Democratic advantage. (For comparable volume for the full period, please see Figure 1A at the back.)
![]()
Figure 1. Advertising Balance in U.S. House and U.S. Senate Races
Nearly 150,000 Undisclosed Ads in Federal Races
A Wesleyan Media Project analysis, in partnership with the Center for Responsive Politics, reveals that over half (56 percent) of the group-sponsored ads aired so far are “dark money” ads (those from sponsors who do not have to disclose their donors) , which have aired at an estimated cost of over $68 million (Figure 2). In Senate races, 57.5 percent of interest group airings were sponsored by 501c4 and 501c6 groups, sometimes referred to as social welfare organizations, which are not required to disclose their donors. Although dark money ad airings make up a smaller proportion of all interest group advertising this cycle compared to last, the total volume of dark money airings has increased in U.S. Senate races from 106,137 at this point in 2012 to 124,281 so far in 2014.
“Dark money ads are on the rise in Senate races, meaning more people are seeing spots from groups they know little about,” said Michael M. Franz, co-director of the Wesleyan Media Project. “Research suggests that those ads are more influential, which is troubling.”
On the House side, dark money advertisers make up 50.2 percent of all interest group ads. As a proportion of all activity, dark money is not as dominant in U.S. House races this cycle; however, the total volume of dark money airings is just shy of the 2012 volume at this point in the cycle (24,847 in 2014 compared to 26,290 in 2012).
![]()
Figure 2: Interest Group Ad Airings in 2012 and 2014 Elections by Disclosure Type*
Americans for Prosperity Top Spending Group; Senate Majority PAC Top Advertiser
As Table 3 shows, the top-spending group is Americans for Prosperity, a Republican-supporting 501(c)4 group that does not disclose its donors. Americans for Prosperity has spent $16.7 million on advertising in nine Senate races, ten House races and the Kansas gubernatorial race, airing 33,127 ads in total. Senate Majority PAC (a SuperPAC that does disclose) has spent almost as much ($16.6 million) to air 33,750 ads, favoring Democratic candidates in 10 different Senate races. The third biggest group spender, a 527 organization called Let’s Get to Work, has dropped almost $13.2 million on ads favoring incumbent Florida governor Rick Scott.
The dominance of non-disclosing dark money groups is evident in the list of top advertisers. Five out of the top ten do not disclose.
![]()
Most Groups Increase Advertising over 2012 Election Cycle
Many of the groups that advertised in House and Senate races in 2012 have increased their activity in these races in 2014 (Table 4). Senate Majority PAC, a group that supports Democratic Senate candidates, had aired about 12,000 ads by the end of August in 2012. By the same point in 2014, the group has aired almost 34,000 ads. A similar increase was evident for Americans for Prosperity, a Republican group, which has increased its ad volume from 8,200 in 2012 to 33,000 in 2014 federal races. Two groups, however, have cut back their involvement in House and Senate advertising: Club for Growth and U.S. Chamber of Commerce.
Interest Groups Dominate Advertising in Competitive Senate Races
Table 5 shows the top ten Senate races by ad count. The race with the highest number of advertisements is in North Carolina, where incumbent Kay Hagen and challenger Thom Tillis face off. Over 44,000 ads, at an estimated cost of $25.2 million, have aired. Remarkably, 80 percent of the ad airings were sponsored by outside groups. It is a pattern that repeats in many of the most competitive Senate races: Interest groups sponsored the majority of the advertising. The most expensive Senate race so far is in Georgia (likely due to higher costs in Georgia markets compared to North Carolina or Kentucky) where David Perdue and Michelle Nunn face each other. Over $26 million has been spent in that race to buy over 37,000 ads.
![]()
The same figures are reported in Table 6 for gubernatorial races. The hot gubernatorial races in 2014 are in Florida and Pennsylvania. In both states, more than 50,000 ads have already aired, fast approaching the 60,800 total ad airings in 2013’s gubernatorial races in Virginia. What separates Florida and Pennsylvania, though, is the extent to which outside groups are involved. In Florida, over half the airings are sponsored by groups, which compares to just 7.5 percent in Pennsylvania.
![]()
The Affordable Care Act Remains a Prominent Target
Although the 2013-2014 open enrollment period has come and gone, attacks on the Affordable Care Act (ACA) have not stopped. In fact, anti-ACA messaging has appeared in roughly one quarter of all federal campaign ads since January 1, 2013, a grand total of 160,636 ads aired across the country. In contrast, a mere 9,264 ads contain somewhat positive (in many cases very oblique, at best not explicitly anti-ACA) language about the law. Not surprisingly, anti-Obamacare messaging was most prominent during the open enrollment period as a proportion of all campaign ads on air (October 1, 2013, through March 31, 2014). In that period, over four in every ten campaign ads aired (42 percent) in U.S. House and U.S. Senate races contained some kind of anti-ACA language. In contrast, the post-enrollment period has seen a drop in the proportion of airings devoted to anti-ACA language (23 percent), but this is primarily due to the increase in campaign messaging generally.
“Anti-ACA messaging has not gone away; in fact, ads attacking the Affordable Care Act have actually increased in number since open enrollment closed,” explained Erika Franklin Fowler, co-director of the Wesleyan Media Project. “Americans across the country are seeing many more political ads going after the ACA than before.”
![]()
Figure 3: Campaign Ads Mentioning the Affordable Care Act
![]()
Figure 4: Campaign Ads Mentioning the Affordable Care Act by Race
About This Report
Data reported here do not cover local cable buys, only broadcast television and national cable buys. All cost estimates are precisely that: estimates. Content information is based on ongoing Wesleyan Media Project coding and analysis of Kantar Media/CMAG video. Disclosure categorization information on interest groups comes from the Center for Responsive Politics.
The Wesleyan Media Project provides real-time tracking and analysis of all political television advertising in an effort to increase transparency in elections. Housed in Wesleyan’s Quantitative Analysis Center – part of the Allbritton Center for the Study of Public Life – the Wesleyan Media Project is the successor to the Wisconsin Advertising Project, which disbanded in 2009. It is directed by Erika Franklin Fowler, assistant professor of government at Wesleyan University, Michael M. Franz, associate professor of government at Bowdoin College and Travis N. Ridout, associate professor of political science at Washington State University. Laura Baum is the Project Manager.
The Wesleyan Media Project is supported by grants from The John S. and James L. Knight Foundation, the MacArthur Foundation and Wesleyan University. Data provided by Kantar Media/CMAG with analysis by the Wesleyan Media Project using Academiclip, a web-based coding tool. The Wesleyan Media Project is partnering in 2014 with both the Center for Responsive Politics, to provide added information on interest group disclosure, and Ace Metrix, to assess ad effectiveness.
The Center for Responsive Politics is the nation’s premier research group tracking money in U.S. politics and its effect on elections and public policy. Nonpartisan, independent and nonprofit, the organization aims to create a more educated voter, an involved citizenry and a more transparent and responsive government. CRP’s award-winning website, OpenSecrets.org, is the most comprehensive resource available anywhere for federal campaign contribution and lobbying data and analysis.
Periodic releases of data will be posted on the project’s website and dispersed via Twitter @wesmediaproject. To be added to our email update list, click here.
For more information contact:
Lauren Rubenstein, lrubenstein@wesleyan.edu, (860) 685-3813
About Wesleyan University
Wesleyan University, in Middletown, Conn., is known for the excellence of its academic and co-curricular programs. With more than 2,900 undergraduates and 200 graduate students, Wesleyan is dedicated to providing a liberal arts education characterized by boldness, rigor and practical idealism. For more, visit www.wesleyan.edu.
About the John S. and James L. Knight Foundation
Knight Foundation supports transformational ideas that promote quality journalism, advance media innovation, engage communities and foster the arts. We believe that democracy thrives when people and communities are informed and engaged. For more, visit www.knightfoundation.org.
About the MacArthur Foundation
The MacArthur Foundation supports creative people and effective institutions committed to building a more just, verdant, and peaceful world. In addition to selecting the MacArthur Fellows, the Foundation works to defend human rights, advance global conservation and security, make cities better places, and understand how technology is affecting children and society. More information is at www.macfound.org.
![]()
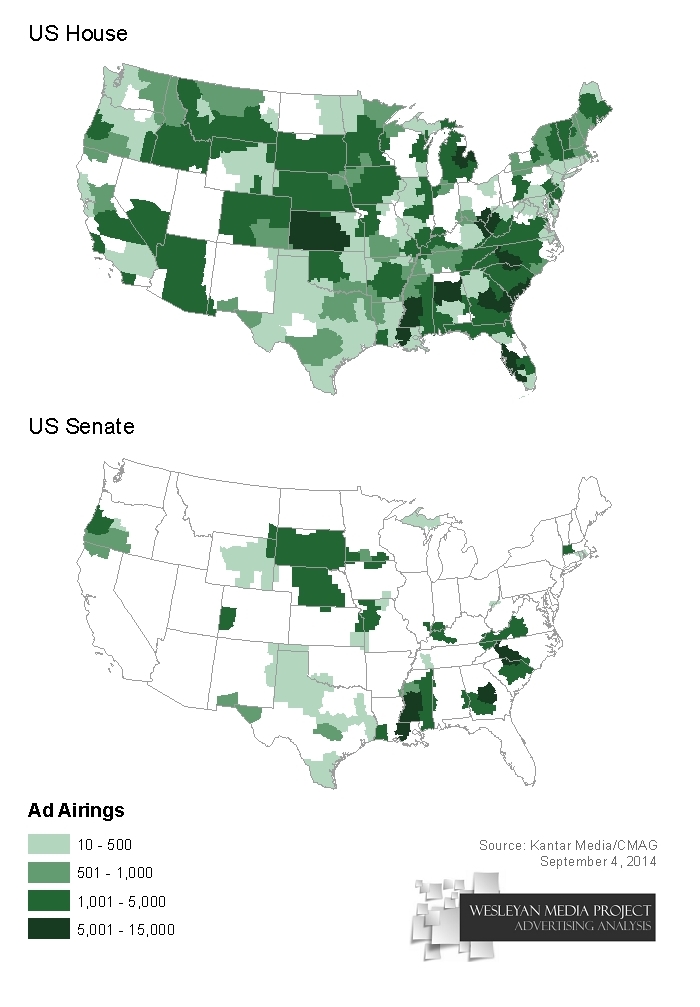
Figure 1A: Volume of Advertising in Federal Races by Media Market (2013-14)
![]()